U.S. Energy Market Assessment: October 2026 Price, Natural Gas, and Supply/Demand Outlook
 admin
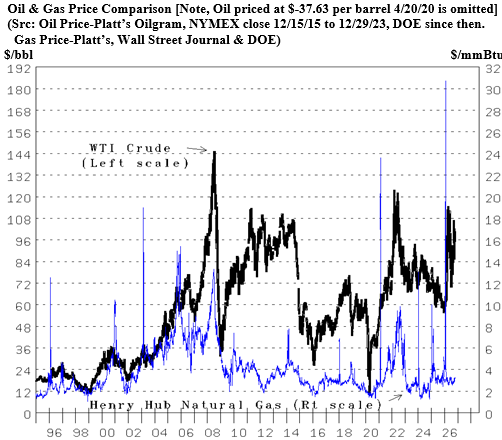
### **U.S. Energy Price Outlook: October 2026 Supply & Demand Assessment**
Geopolitical tensions—specifically regarding the Strait of Hormuz and ongoing anti-terrorism military efforts—alongside wet summer and fall weather, have created a “buy-low” opportunity for crude oil and natural gas.
Although winter conditions pushed energy equities significantly higher earlier in the year, peaceful developments in June briefly lowered the Oil Index (XOI). However, persistent supply disruptions have reversed this trend. Year-to-date (YTD), the XOI is up 81.6%, and the Oil & Gas Exploration Index (XOP) gained 47.2% as of yesterday. Meanwhile, localized heat waves combined with high precipitation in populous regions have lifted the Natural Gas Index (XNG) by 19.7%.
Despite persistent policy pushes to eliminate fossil fuels, regulatory hurdles—such as California’s opposition to restored offshore pipelines—continue to stifle domestic energy infrastructure investment. Nevertheless, growing global demand and rising power consumption, heavily driven by the expansion of Artificial Intelligence (AI), highlight the need for rapid grid expansion. Because nuclear infrastructure takes time to deploy, natural gas-fired generation remains the fastest, most economical solution.
—
### **Price Forecast Summary**
| Commodity / Metric | Forecast & Market Expectations | Key Drivers |
| :— | :— | :— |
| **WTI Crude Oil** | Sustained at **$80+ / bbl** for several years | Middle East recovery, infrastructure repair, global demand growth. |
| **Henry Hub Natural Gas** | Long-term target of **$7.00+ / MMBtu** | Surge in AI power demand, LNG export needs, historical underinvestment. |
| **U.S. Trade Position** | Strong net exporter advantage | Capital inflows rising alongside global energy price adjustments. |
| **Sector Rating** | **Overweight / Strong Buy** | Crude Oil, Oil-Focused E&P, Drilling, Oilfield Services, Refining. |
—
### **Natural Gas & Crude Oil Spot Dynamics**
* **Natural Gas Volatility:** After reaching historic highs of $23.61 in February 2021 and $30.72 in January 2026, rapid production growth combined with mild winter weather pushed prices to lows near $1.23–$1.24 in 2024. Despite prices temporarily settling below $3.40 due to high storage levels, projected baseline demand supports a recovery toward $7.00/MMBtu.
* **Crude Oil Recovery:** Following the extreme market distortions of 2020, West Texas Intermediate (WTI) crude has established a long-term upward trajectory. Ongoing economic momentum, trade adjustments, and geopolitical stabilization efforts point toward sustained pricing above $80/bbl, signaling the necessity for an extended multi-year drilling cycle.
—
### **Equity Index Performance Metrics**
Energy equities remain historically undervalued relative to broader market indices, primarily due to lingering market assumptions regarding production ease and transition timelines.
* **S&P 500 YTD:** +13.1%
* **NASDAQ YTD:** +14.9%
* **Natural Gas Index Change:** Recovered from a low of 234.06 in March 2020 to 1,339.57, though remaining slightly below its June 2022 high.
To support global consumption and long-term energy security, substantial capital deployment into drilling services and production capacity will be required over the coming decade.
—
*Authored by Michael Smolinski (Energy Directions) for Oil & Gas 360.*
*Disclaimer: The views expressed belong solely to the author and do not constitute financial advice. Investors should perform independent research before making capital allocations.*